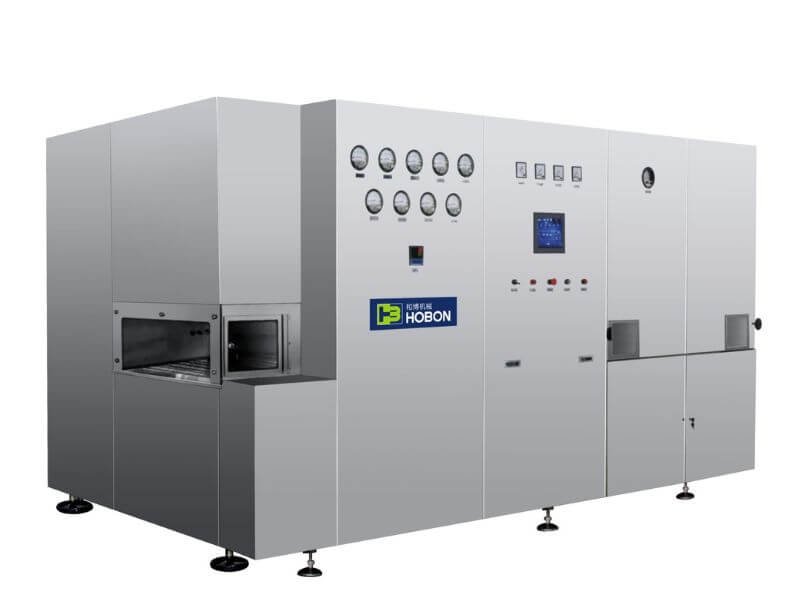
A dry-heat tunnel oven is used to process glass vials before aseptic filling. During operation, hot air transfers heat to vials moving through the tunnel on a conveyor belt. However, the air temperature inside the heating zone is not necessarily the temperature reached by every point on every vial.
The vial’s temperature-rise profile can help engineers understand heat transfer, identify the slowest-heating location, and evaluate how operating conditions may affect the process. Computational fluid dynamics (CFD) can provide a visual way to study airflow and vial heating—but simulation results need to be interpreted within the limits of the model and confirmed through appropriate process studies.
How a Hot-Air Tunnel Oven Works
A hot-air tunnel oven commonly has three zones: preheating, heating and cooling. Vials travel on a conveyor belt from the preheating section into the heating zone and then through the cooling section.
In the source study, the tunnel’s circulating hot air was described as being heated to 300–350°C and filtered before being directed over the vials. This is the operating description reported by that study; it should not be treated as a universal setpoint for every tunnel or vial format.[1]
Air temperature, air velocity and conveyor speed are important design and operating parameters. The vial’s size, glass mass, position and exposure to airflow also affect how quickly different parts of the vial heat up.
CFD Study of a 10 mL Vial
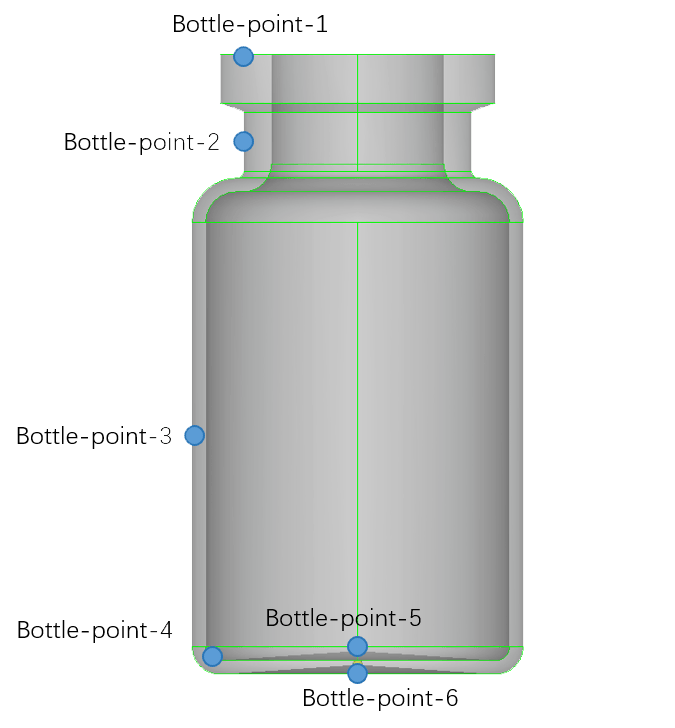
The study tracked temperature at six points on a 10 mL vial:
- Upper area near the vial opening
- Vial neck
- Middle of the vial body
- Inner edge of the vial base
- Center of the inner vial base
- Center of the vial bottom
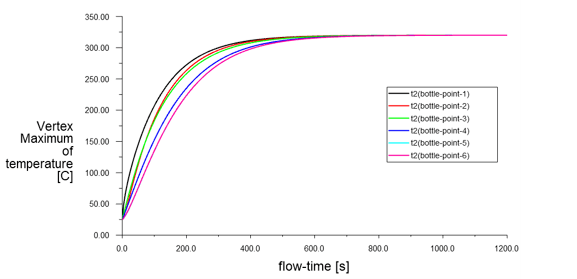
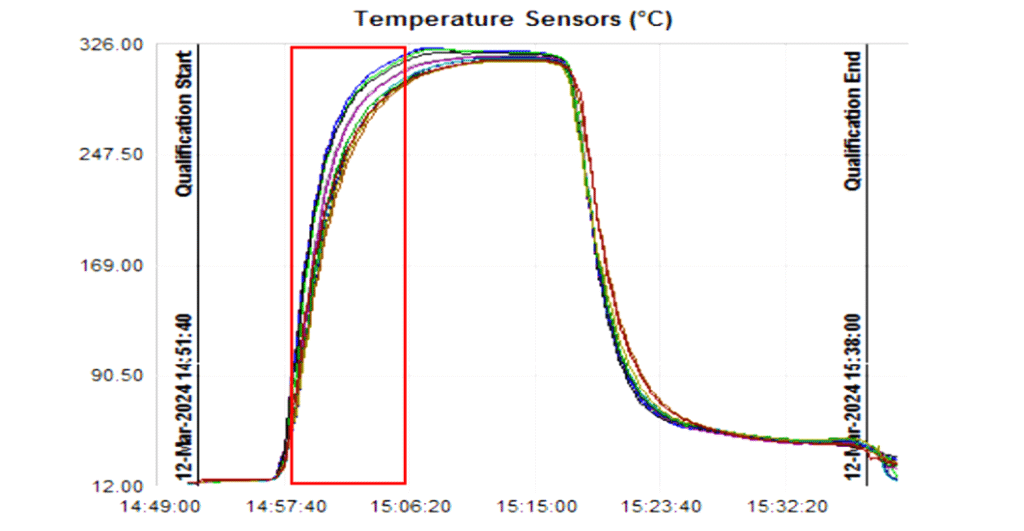
For the simulated condition—hot air at 320°C, air velocity of0.45 m/s, and an initial ambient temperature of25°C—the bottom of the vial heated more slowly than the upper area near the opening, the neck, the middle of the body and the inner edge.
The temperature curves for the center of the vial bottom and the center of the inner base were nearly identical. Both were identified as the slowest-heating locations in this model. The study reported that the coldest point reached 300°C after a little more than 7 minutes. The measured temperature curve showed approximately8 minutes to reach 300°C under the reported test condition.[1]
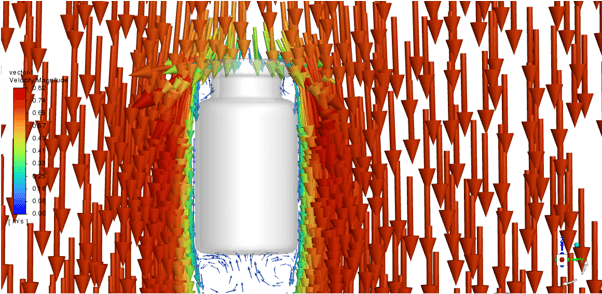
The study’s airflow visualization showed air passing around the vial body. It attributed the slower heating at the bottom to the lower local airflow velocity and slower heat transfer in that area.
Reported temperature-rise results
| Case | Reported condition | Reported result |
|---|---|---|
| 10 mL vial, base case | 320°C hot air; 0.45 m/s; initial ambient temperature 25°C | The modeled cold point reached 300°C after a little more than 7 minutes; the measured curve showed approximately 8 minutes |
| Different airflow velocities | 300°C hot air; 0.45 and 0.7 m/s | The modeled vial took at least about 12 minutes to approach 300°C; higher air velocity shortened the predicted heating time |
| Higher air temperature and velocity | 320°C hot air; 0.7 m/s | The reported time for the cold point to reach 300°C was about 320 seconds |
| Different vial sizes | 320°C hot air; 0.7 m/s; initial ambient temperature 25°C | The modeled time to reach 300°C was about 316 seconds for 2 mL, 435 seconds for 20 mL and 1,271 seconds for 100 mL |
All measurements and estimates in this table are specific to the case reported in the cited study.[1] They are not equipment performance figures for Weida Hebo, nor universal process settings.
In the study, increasing the hot-air temperature or velocity made the predicted temperature-rise curve steeper and shortened the time needed to reach 300°C. The authors also noted that higher temperatures could increase energy use, widen temperature differences between vial locations and raise the risk of uneven heating or vial breakage. The study does not establish a universal breakage rate; actual risk depends on the equipment, vial characteristics and heating and cooling conditions.
Why Vial Size Matters
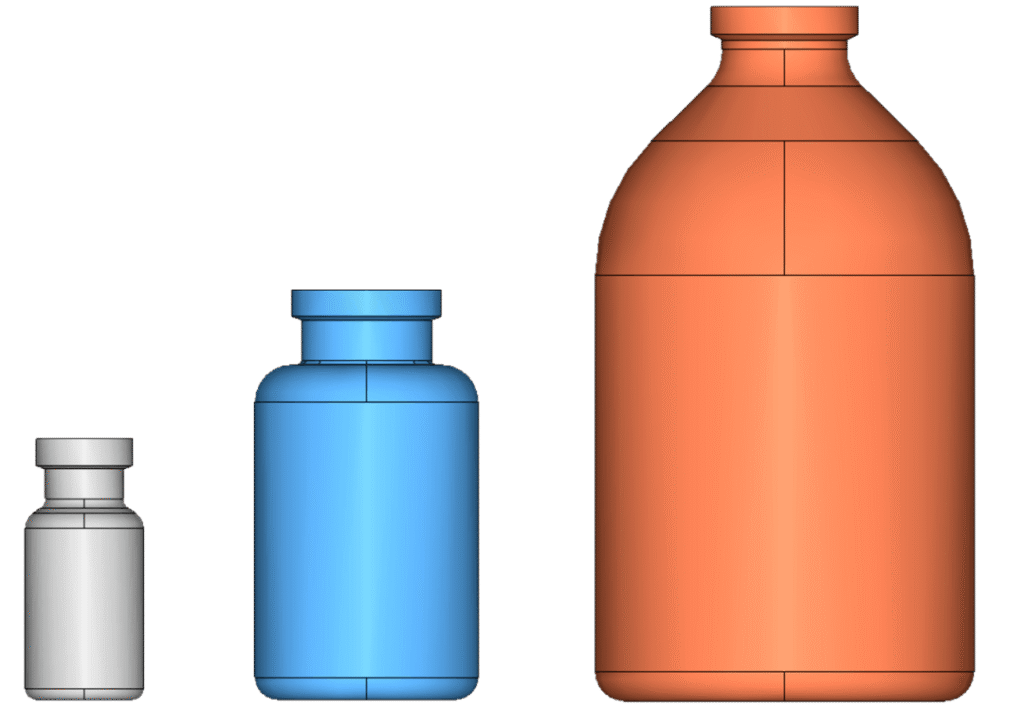
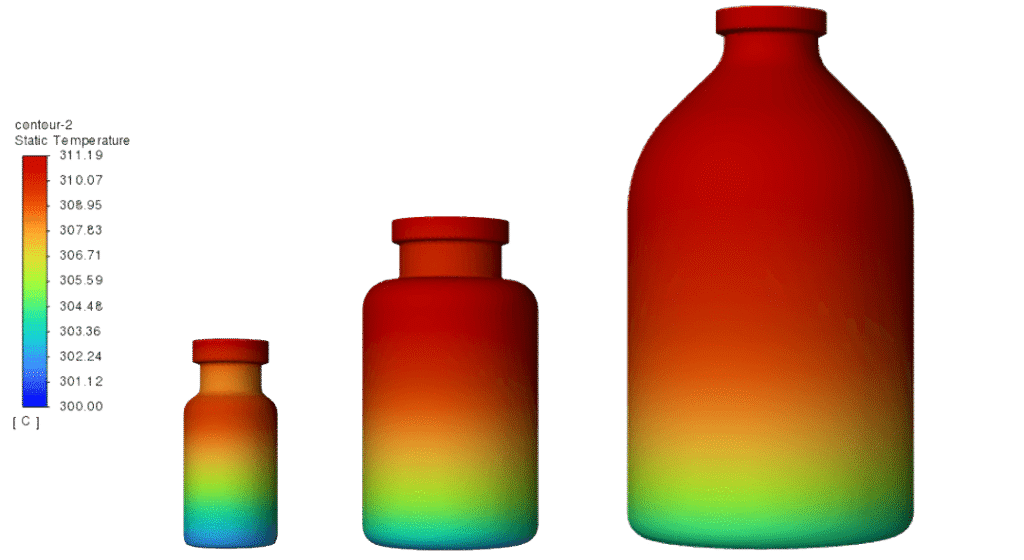
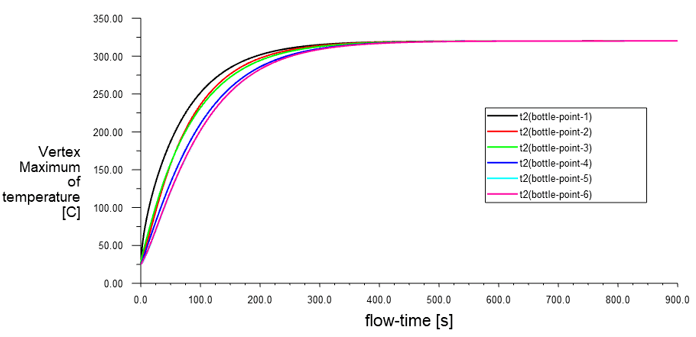
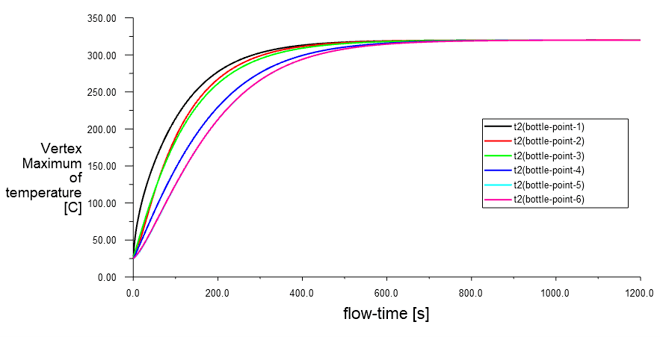
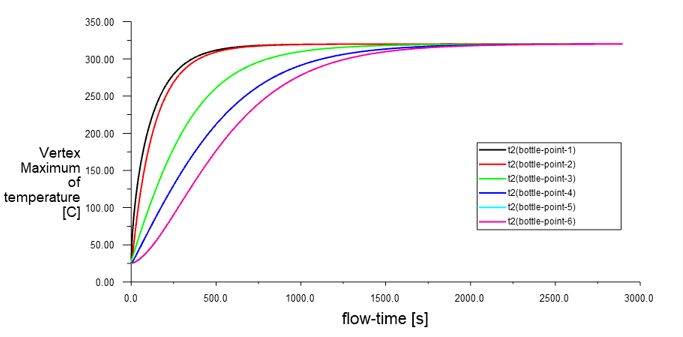
The study also modeled 2 mL, 20 mL and 100 mL vials under the same stated conditions: hot air at 320°C, air velocity of0.7 m/s, and an initial ambient temperature of25°C.
The larger the vial format, the longer the reported time for its cold point to reach 300°C:
- 2 mL: approximately 316 seconds
- 20 mL: approximately 435 seconds
- 100 mL: approximately 1,271 seconds
The study also found that the temperature-rise trends differed more between measurement points as vial size increased. These results support a practical design consideration: different vial formats may require different process settings, rather than assuming one heating profile will suit every container size.[1]
What a Separate CFD Study Adds
A separate peer-reviewed study modeled the airflow and temperature fields in a depyrogenation tunnel. It compared several mesh sizes and selected a model with approximately 6.05 million mesh elements. Between the 5.69-million and 6.05-million mesh models, the reported change in average outlet velocity was0.54%. The model examined inlet velocities of4.2, 6 and 8 m/s at an inlet-air temperature of 573 K, approximately300°C.[2]
That study reported low-velocity vortices near chamber walls and non-uniform airflow and temperature distribution. These results provide additional examples of how CFD may help identify areas for closer engineering review.
A mesh-independence check helps assess whether a numerical result changes significantly as the mesh is refined. It does not, by itself, prove that a vial has received adequate thermal exposure or that a depyrogenation process is effective. The two studies also used different models and conditions; their numerical results should not be combined as if they described the same machine.
CFD Results Must Be Interpreted Alongside Validation
Reaching 300°C in a simulation is not, by itself, proof that sterilization or depyrogenation has been achieved. A temperature-rise time is not the same as a validated holding time or a demonstrated endotoxin reduction.
EU GMP Annex 1 states that dry-heat processes should deliver an adequate and reproducible level of lethality and/or endotoxin reduction. For thermal depyrogenation, it calls for validation demonstrating a suitable Fh value and at least a 3-log10 reduction in endotoxin concentration. It also addresses endotoxin-spiked containers, container representativeness and recovery efficiency.[3]
The FDA’s aseptic-processing guidance describes a similar validation approach, including demonstrating at least a 99.9% (3-log) reduction, appropriate heat-distribution and heat-penetration studies, and worst-case cycles that reflect container characteristics and loading configurations.[4] EU GMP Annex 1 also states that, for heat-sterilization cycles, the entire load should reach the required temperature before the sterilizing time period starts.[3]
These requirements make the distinction clear: CFD supports analysis and design; process validation provides evidence that a defined process works for its intended load.
Applying CFD to Tunnel-Oven Design
CFD can support the evaluation of tunnel structure and process parameters, including hot-air temperature, air velocity and conveyor-belt speed. Used with physical measurements, it can help engineers:
- Identify slow-heating locations and non-uniform airflow.
- Compare predicted temperature trends for different vial formats.
- Evaluate where to place temperature probes during testing.
- Investigate whether changes in airflow or heating conditions affect temperature distribution.
- Inform process-parameter selection while considering throughput, energy use and vial integrity.
A useful workflow is to model the expected equipment and vial conditions, identify locations for testing, compare the predictions with measured heat-distribution and heat-penetration results, and then qualify the intended process under representative and worst-case conditions.
Integrating the Tunnel into a Vial Line
A tunnel oven is one stage in vial preparation and filling. The washing step, tunnel configuration and transfer to the filling area should be considered as part of the overall line layout.
For more information, explore Weida Hebo’s tunnel sterilizer oven, linear ultrasonic bottle washing machine, liquid vial filling line and powder vial filling line.
When discussing a project, manufacturers can provide vial formats, vial drawings or samples, target throughput, loading arrangement and line layout for equipment and process review.
Frequently Asked Questions
Does reaching 300°C prove that vials are depyrogenated?
No. The source study reports how long its modeled cold point took to reach 300°C. That result does not, on its own, establish a validated holding time or demonstrate a specified endotoxin reduction.
Can the reported heating times be applied to every tunnel oven?
No. The values are specific to the reported model, conditions and vial formats. Actual results depend on equipment design, airflow, loading pattern, vial characteristics and operating conditions.
Why did the bottom of the vial heat more slowly in the 10 mL model?
In that model, the vial bottom was exposed to lower local airflow velocity, and its temperature rose more slowly than the upper and middle areas. The cold spot should be confirmed for the specific equipment and load rather than assumed to be identical in every system.
References
- Wang, Zhigang. “基于 CFD 仿真技术的隧道灭菌烘箱西林瓶温升曲线模拟分析” [CFD-Based Simulation Analysis of Vial Temperature-Rise Curves in a Tunnel Sterilization Oven]. 流程工业 [Process Industry], No. 8 (2024), pp. 46–49. Article in Chinese. Source for the original simulation conditions, temperature-rise values and conclusions reported in this article.
- Wang, Y., Zhu, Q., Huang, T., Han, X., & Lin, M. (2024). “Modelling and Simulation of Nonlinear Dynamic Flow Field and Temperature Field of Depyrogenation Tunnel.” Facta Universitatis, Series: Mechanical Engineering, 22(1), 45–62. https://doi.org/10.22190/FUME221221011W
- European Commission. EudraLex Volume 4, Annex 1: Manufacture of Sterile Medicinal Products (2022), sections 8.52 and 8.66–8.69. Official PDF
- U.S. Food and Drug Administration. Sterile Drug Products Produced by Aseptic Processing—Current Good Manufacturing Practice (2004), section on preparation of containers and closures. Official guidance
